Posted by Tyler Wood Crime Tech Solutions, your source for investigation software.
The information provided on this page comes primarily from Boba, R. (2008: Pages 3 through 6) Crime Analysis with Crime Mapping. For a full discussion of the crime analysis discipline, refer to the book which can be obtained through www.sagepub.com.
Over the past 20 years, many scholars have developed definitions of crime analysis. Although definitions of crime analysis differ in specifics, they share several common components: all agree that crime analysis supports the mission of the police agency, utilizes systematic methods and information, and provides information to a range of audiences. Thus, the following definition of crime analysis is used as the foundation of this initiative:
Crime analysis is the systematic study of crime and disorder problems as well as other police–related issues—including sociodemographic, spatial, and temporal factors—to assist the police in criminal apprehension, crime and disorder reduction, crime prevention, and evaluation.
Clarification of each aspect of this definition helps to demonstrate the various elements of crime analysis. Generally, to study means to inquire into, investigate, examine closely, and/or scrutinize information. Crime analysis, then, is the focused and systematic examination of crime and disorder problems as well as other police-related issues. Crime analysis is not haphazard or anecdotal; rather, it involves the application of social science data collection procedures, analytical methods, and statistical techniques.
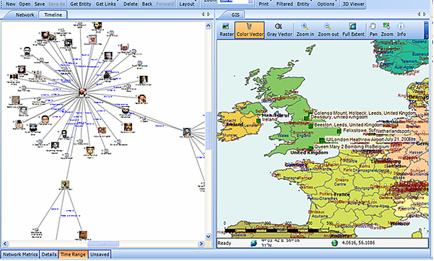
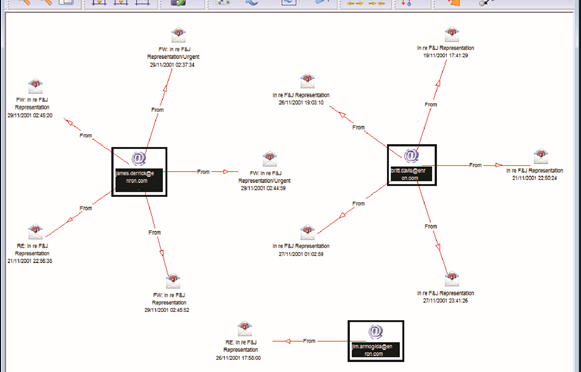
More specifically, crime analysis employs both qualitative and quantitative data and methods. Crime analysts use qualitative data and methods when they examine non-numerical data for the purpose of discovering underlying meanings and patterns of relationships. The qualitative methods specific to crime analysis include field research (such as observing characteristics of locations) and content analysis (such as examining police report narratives). Crime analysts use quantitative data and methods when they conduct statistical analysis of numerical or categorical data. Although much of the work in crime analysis is quantitative, crime analysts use simple statistical methods, such as frequencies, percentages, means, and rates. Typical crime analysis tools include link analysis and crime mapping software.
The central focus of crime analysis is the study of crime (e.g., rape, robbery, and burglary); disorder problems (e.g., noise complaints, burglar alarms, and suspicious activity); and information related to the nature of incidents, offenders, and victims or targets of crime (targets refer to inanimate objects, such as buildings or property). Crime analysts also study other police-related operational issues, such as staffing needs and areas of police service. Even though this discipline is called crime analysis, it actually includes much more than just the examination of crime incidents.
Although many different characteristics of crime and disorder are relevant in crime analysis, the three most important kinds of information that crime analysts use are sociodemographic, spatial, and temporal. Sociodemographic information consists of the personal characteristics of individuals and groups, such as sex, race, income, age, and education. On an individual level, crime analysts use sociodemographic information to search for and identify crime suspects. On a broader level, they use such information to determine the characteristics of groups and how they relate to crime. For example, analysts may use sociodemographic information to answer the question, “Is there a white, male suspect, 30 to 35 years of age, with brown hair and brown eyes, to link to a particular robbery?” or “Can demographic characteristics explain why the people in one group are victimized more often than people in another group in a particular area?”
The spatial nature of crime and other police-related issues is central to understanding the nature of a problem. In recent years, improvements in computer technology and the availability of electronic data have facilitated a larger role for spatial analysis in crime analysis. Visual displays of crime locations (maps) and their relationship to other events and geographic features are essential to understanding the nature of crime and disorder. Recent developments in criminological theory have encouraged crime analysts to focus on geographic patterns of crime, by examining situations in which victims and offenders come together in time and space.
Finally, the temporal nature of crime, disorder, and other police-related issues is a major component of crime analysis. Crime analysts conduct several levels of temporal analysis, including (a) examination of long-term patterns in crime trends over several years, the seasonal nature of crime, and patterns by month; (b) examination of mid-length patterns, such as patterns by day of week and time of day; and (c) examination of short-term patterns, such as patterns by day of the week, time of day, or time between incidents within a particular crime series.
The final part of the crime analysis definition—”to assist the police in criminal apprehension, crime and disorder reduction, crime prevention, and evaluation” generally summarizes the purpose and goals of crime analysis. The primary purpose of crime analysis is to support (i.e., “assist”) the operations of a police department. Without police, crime analysis would not exist as it is defined here.
The first goal of crime analysis is to assist in criminal apprehension, given that this is a fundamental goal of the police. For instance, a detective may be investigating a robbery incident in which the perpetrator used a particular modus operandi (i.e., method of the crime). A crime analyst might assist the detective by searching a database of previous robberies for similar cases.
Another fundamental police goal is to prevent crime through methods other than apprehension. Thus, the second goal of crime analysis is to help identify and analyze crime and disorder problems as well as to develop crime prevention responses for those problems. For example, members of a police department may wish to conduct a residential burglary prevention campaign and would like to target their resources in areas with the largest residential burglary problem. A crime analyst can assist by conducting an analysis of residential burglary to examine how, when, and where the burglaries occurred along with which items were stolen. The analyst can then use this information to develop crime prevention suggestions, (such as closing and locking garage doors) for specific areas.
Many of the problems that police deal with or are asked to solve are not criminal in nature; rather, they are related to quality of life and disorder. Some examples include false burglar alarms, loud noise complaints, traffic control, and neighbor disputes. The third goal of crime analysis stems from the police objective to reduce crime and disorder. Crime analysts can assist police with these efforts by researching and analyzing problems such as suspicious activity, noise complaints, code violations, and trespass warnings. This research can provide officers with information they can use to address these issues before they become more serious criminal problems.
The final goal of crime analysis is to help with the evaluation of police efforts by determining the level of success of programs and initiatives implemented to control and prevent crime and disorder and measuring how effectively police organizations are run. In recent years, local police agencies have become increasingly interested in determining the effectiveness of their crime control and prevention programs and initiatives. For example, an evaluation might be conducted to determine the effectiveness of a two-month burglary surveillance or of a crime prevention program that has sought to implement crime prevention through environmental design (CPTED) principles within several apartment communities. Crime analysts also assist police departments in evaluating internal organizational procedures, such as resource allocation (i.e., how officers are assigned to patrol areas), realignment of geographic boundaries, the forecasting of staffing needs, and the development of performance measures. Police agencies keep such procedures under constant scrutiny in order to ensure that the agencies are running effectively.
In summary, the primary objective of crime analysis is to assist the police in reducing and preventing crime and disorder. Present cutting edge policing strategies, such as hotspots policing, problem-oriented policing, disorder policing, intelligence-led policing, and CompStat management strategies, are centered on directing crime prevention and crime reduction responses based on crime analysis results. Although crime analysis is recognized today as important by both the policing and the academic communities, it is a young discipline and is still being developed. Consequently, it is necessary to provide new and experienced crime analysts with training and assistance that improves their skills and provides them examples of best practices from around the country and the world. http://crimetechsolutions.com
 In the release of a not so well-kept industry secret, Trimble (NASDAQ: TRMB) finally announced this week (February 29, 2016) that it has sold The Omega Group assets to TriTech Software Systems, a leading provider of public safety software. The Omega Group is a large provider of crime mapping software, known for its popular CrimeView™ desktop software and the www.crimemapping.com™ website which allows agencies to present crime statistics to the public in a heat map format.
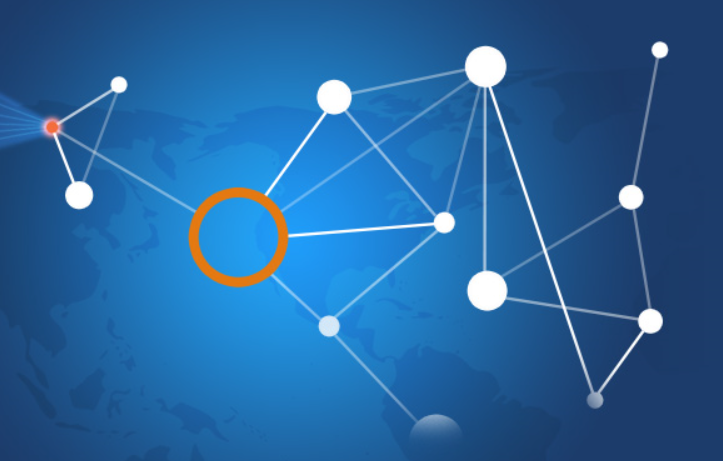
 This is a very interesting read about the current big data analytics darling, Palantir Technologies. The article from GS Early appears on the Personal Liberty website