Showing off all your hard work and in-depth analysis will be easier and faster than ever with Visallo 4.0, thanks to a host of new formatting and annotation options for graphs and maps. CLICK HERE for a sneak peak of what to expect with the new release.
Tag Archives: big data
Big Data Surveillance: The Case of Policing
Posted by Douglas Wood, CEO of Case Closed Software – a leader in investigation software and analytics for law enforcement.
Headquartered here in Central Texas, I recently had an opportunity to have coffee with Dr. Sarah Brayne, Assistant Professor, Department of Sociology at The University of Texas at Austin. Ms. Brayne had just published an interesting article in The American Sociological Review. The article is titled Big Data Surveillance: The Case of Policing.
The article examines the intersection of two emerging developments: the increase in surveillance and the massive exploration of “big data.” Drawing on observations and interviews conducted within the Los Angeles Police Department, Sarah offers an empirical account of how the adoption of big data analytics does—and does not—transform police surveillance practices.
She argues that the adoption of big data analytics facilitates may amplify previous surveillance practices, and outlines the following findings:
- Discretionary assessments of risk are supplemented and quantified using risk scores.
- Data tends to be used for predictive, rather than reactive or explanatory, purposes. (Here, Crime Tech Weekly would want to differentiate between predictive analytics and investigation analytics)
- The proliferation of automatic alert systems makes it possible to systematically surveil an unprecedentedly large number of people.
- The threshold for inclusion in law enforcement databases (gang databases, criminal intelligence data, etc) is lower, now including individuals who have not had direct police contact. (Here again, Crime Tech Weekly would point out that adherence to criminal intelligence best practices vastly reduces this likelihood)
- Previously separate data systems are merged, facilitating the spread of surveillance into a wide range of institutions.
Based on these findings, Sarah develops a theoretical model of big data surveillance that can be applied to institutional domains beyond the criminal justice system. Finally, she highlights the social consequences of big data surveillance for law and social inequality.
The full PDF report can be downloaded via Sage Publishing by clicking here. Or, if you have general comments or questions and do not wish to download the full version, please feel free to contact us through the form below. Crime Tech Weekly will be happy to weigh in.
[contact-form][contact-field label=”Name” type=”name” required=”1″ /][contact-field label=”Email” type=”email” required=”1″ /][contact-field label=”Website” type=”url” /][contact-field label=”Comment” type=”textarea” required=”1″ /][/contact-form]

Data Analytics Transforms Policing
 Great article from our friends at Visallo!
As police find new methods of tracking and solving crime, their needs and priorities in a data analytics strategy are bound to continuously evolve.
Be sure to read the article at the popular Visallo Blog, and for more information on how Visallo and Crime Tech Solutions are changing the investigation analytics world, contact us with the form below.
[contact-form][contact-field label=”Name” type=”name” required=”1″ /][contact-field label=”Email” type=”email” required=”1″ /][contact-field label=”Website” type=”url” /][contact-field label=”Comment” type=”textarea” required=”1″ /][/contact-form]
Big Data Investigation Analytics: A Difference Maker for Law Enforcement
How Investigative Agencies do More with Less!
The investigative units of law enforcement agencies all around the world face many of the same challenges. Chief among those challenges is the fact that budgets are tightening, while resources are becoming more and more scarce. Even in the face of reduced funding, investigators are asked to deliver higher levels of service in their quest to solve and deter crime.
The key to doing ‘more’ with ‘less’ in law enforcement is really no different than in any other industry. That is, deploying resources in the most effective manner possible for the maximum value possible. The trick is using what the agency already knows to determine what the future may hold. What that all boils down to is Big Data Investigation Analytics.
Data in Law Enforcement comes in many forms, and is typically stored in disparate silos. Arrest records, calls for service, criminal intelligence, field reports, human resource data, telephone records, case management files, and so on. Together, the data from those systems can represent a virtual goldmine of investigative information if used correctly.
 ‘Correctly’ is the operative term, of course. The ability to turn these large data stores into actionable investigation intelligence requires more than a simple data warehouse or data mining tool, and for the most part police departments recognize this need. They understand that their data holds the key to understanding the hidden connections between people, places, and things – the lynchpin of any successful investigation.
For years, law enforcement agencies and commercial organizations have built data mining tools and data warehouses. Unfortunately, these analytical techniques are no longer sufficient in an age of rapidly growing data. Moreover, much of the data that investigators need to access is unstructured text – word processing documents, narratives, search warrants, witness statements, email text, and more. By applying big data text analytics, investigators can begin to extract actionable insights from both structured and unstructured data.
 Big Data Investigation Analytics – such as those provided by Virginia based Visallo and California’s Palantir Technologies – are two examples that provide a powerful indexing architecture allowing investigators to find non-textual data, including multimedia files such as 911 calls, interrogation videos, and images. This architecture helps investigators find things that they simply could not find otherwise.
Finally, world-class investigation analytics provide a flexible graph visualization tool, as well. This user interface allows investigators to organize data through a variety of layout options, find hidden and non-obvious relationships between entities, and perform a variety of what-if scenarios.
 When paired with the robust investigative case management and criminal intelligence systems available from Crime Tech Solutions, big data investigation analytics build a foundation upon which investigators can solve more crimes, more quickly.
Without advanced investigation analytics, agencies often find themselves looking for a needle in a haystack. In fact, too often the needle is broken into several pieces spread across multiple haystacks. To simplify these tasks, investigative agencies must deploy the correct analytical technologies which have become a key element of doing more with less in the global investigation market. For more information on how Crime Tech Solutions and Visallo are changing the law enforcement analytics landscape, please contact us below!
[contact-form][contact-field label=”Name” type=”name” required=”1″ /][contact-field label=”Email” type=”email” required=”1″ /][contact-field label=”Website” type=”url” /][contact-field label=”Comment” type=”textarea” required=”1″ /][/contact-form]

Palantir® and NYPD face off over data and deliverables disputes
The shine is most definitely coming off the Palantir® Technologies brand in law enforcement and investigative agencies. Here’s a link to a fascinating story about NYPD and Palantir, and how the former is kicking the latter to the curb. The power that Palantir has over its customers is down-right frightening.
Fear not, Palantir clients… Something big is happening HERE!
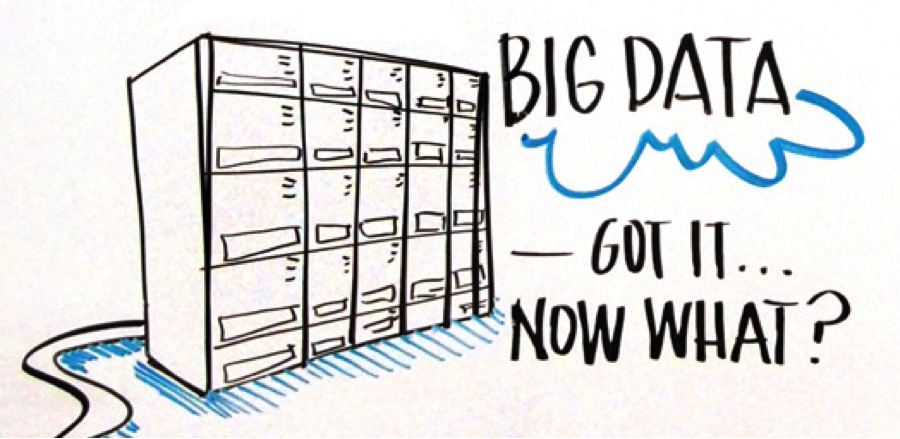
Law Enforcement: Got Big Data… Now What?
Great article from PoliceMag.com, originally posted HERE.
Since its introduction nearly a decade ago, big data in the form of analytics has helped police agencies all over the world enhance decision making, improve strategies to combat crime, and ultimately solve—and prevent—more crimes. But while the benefits of mining and critically analyzing huge amounts of data are being realized in other developed countries from the United Kingdom to Canada to New Zealand, U.S. law enforcement agencies have generally been slower to jump on the bandwagon.
The reasons for slower adoption of big data tools in the United States are as varied as the nearly 18,000 state and local law enforcement agencies around the country. For many, the decision to buy or not to buy advanced crime analytics software often comes down to the usual culprit: lack of money. With few exceptions, police agencies across the country are faced with the prospect of doing more with less. And with increased pressure on local departments to put more feet on the street, do more in terms of community policing, and divert funding to equip all officers with body cams, it’s often hard for departments to make big data solutions a top priority.
Money, however, is not the only issue slowing analytics adoption in the U.S. Unlike countries such as the U.K., the American law enforcement community is decentralized. It does not have a single system of data, standards, and operations. Rather, police departments here pride themselves on their individuality and independence. Walk into a meeting where 10 different departments are represented and you will likely see 10 different colors of uniforms.
The same holds true when it comes to information sharing. While it is often assumed that police departments all work in close cooperation with each other, the reality may be quite different.
 None of this is news, nor is it a criticism of U.S. police departments. It simply reflects Americans’ independent nature and the way in which law enforcement in this country is structured. It’s the thing that makes us great but, in the case of analytics, it’s also a major factor slowing analytics adoption.
Big data adoption is also hampered by the sheer size of the U.S. Sure, from a pure geographic standpoint, the U.S. and Canada are similar in size. But most of Canada’s people live in Ontario or on the West Coast, near Vancouver. There are just over 200 police departments in all of Canada. Compare that to the U.S., where there are huge differences in the make-up of the population, not to mention lifestyle, attitudes, and so much more between, say, the Southwest and the Northeast.
Law enforcement policy-makers on the East Coast don’t know what to make of their counterparts on the West Coast and vice versa. Similarly, the day-to-day needs and demands placed on a police chief in Kansas City can’t help but be very different from those of his or her peers in Chicago, Los Angeles, Seattle, or Philadelphia.
 All of these factors have contributed to slowing the adoption of analytics by U.S. police agencies. They are also complicated by perhaps the most intangible impediment: fear of technology. Whether they like to admit it or not, some law enforcement leaders are more comfortable taking an “old school” approach to police work. They prefer business as usual, which means feet on the street and files stacked on their detectives’ desks, not sleek, state-of-the-art technology.
Change is never easy, especially when tried-and-true policing methods have proven to be effective. Decentralization also plays a part here – it’s easier to take technology risks when it’s mandated from above and much harder for the nearly 18,000 law enforcement chiefs in the U.S. to each take a step into the unknown. Nevertheless, change is coming, spurred in large part by the fact that the cost of advanced crime analytics is coming down.
Also easing the impact of costs to local agencies will be the dollars for big data solutions coming from the federal government. Those funds come with a catch, however, that gets at another obstacle. A significant portion of federal funds in the future will be earmarked for supporting regional initiatives. That means to be eligible for federal funds, many departments will have no choice but to work with their colleagues across jurisdictional boundaries. And while that may bring some initial resistance, regional cooperation will inevitably help to promote not just data sharing, but overall effectiveness.
 The public is also demanding increased police effectiveness and efficiency. Responding to that pressure, police chiefs are recognizing that big data solutions can have a huge impact on reducing the number of man-hours it takes to sift through mountains of data in order to solve crimes. This is particularly important as law enforcement finds itself confronting not only the standard array of home break-ins, car thefts, and the like, but also the threat of “lone wolf” terrorist attacks, cybercrime, and highly sophisticated international trafficking rings.
Fortunately, as analytics software has become more affordable, it has also become easier to use. No longer the exclusive domain of the IT department, newer big data solutions are now designed to be used by front line analysts and investigators, with just one or two days of training and without the need for sophisticated oversight.
This has dramatically changed the role of law enforcement analysts. Formerly the department statistician, today’s analyst has become a critically important member of the crime fighting team, capable of rapidly moving from tactical analysis to the focal point of providing intelligence on high-profile crimes and strategic crime-fighting initiatives.
Ease of use also comes into play as a new generation of officers, many of whom were raised on Google and Xbox, begin to take on leadership roles in their departments. These individuals are used to having the latest technology at their immediate disposal. They will readily see that a big data solution can not only play a critical role in more effective policing, but also pay for itself in savings of both time and money.
 The growing use of cloud computing plays a role in this equation. Storing data in the cloud is becoming accepted as safe and secure, bringing with it economic advantages and removing the need for departments to provide highly specialized IT staff and infrastructure previously required to support analytical solutions.
All of these factors are combining to change the face of effective policing in the U.S. That will mean significantly greater acceptance of analytics to mine everything from social media files, emails, text messages, and the content of police RMS systems to phone records, license plate reader data, and ballistics data. Efficiencies of scale will dictate greater cooperation among departments, resulting in increased efficiency and more effective policing. Being able to quickly search and find critical information in data that police agencies already have in hand will undoubtedly improve decision making and officer safety, while helping to solve cases more quickly.
 Crime Tech Solutions, who earlier this year acquired TN based Case Closed Software, delivers unique value to customers with comprehensive investigative case management software, sophisticated link analysis tools, criminal intelligence management software, and crime mapping technology that includes some of the industry’s best analytics and reporting capabilities.
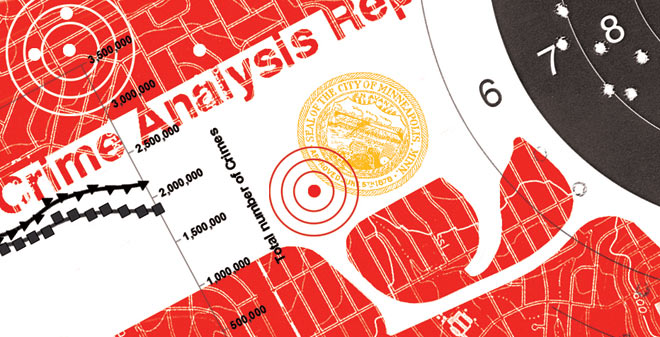
IBM Crime Analytics: Missing the mark? CTS Hits the bullseye!
 Posted by Crime Tech Solutions – Your source for analytics in the fight against crime and fraud.
September 7, 2015. IBM announced this week a major update to its IBM i2 Safer Planet intelligence portfolio that includes a major overhaul of the widely used Analyst’s Notebook product. The product, which has become increasingly abandoned by its user base over the past five years, is now being positioned as ‘slicker‘ than previous versions.
IBM suggests that the new version scales from one to 1,000 users and can ingest petabytes of information to visualize. (A single petabyte roughly translates to 20,000,000 four-drawer filing cabinets completely filled with text).
That’s a lot of data. Seems to me that analysts are already inundated with data… now they need more?
This all begs the question: “Where is IBM headed with this product?”
The evidence seems to point to the fact that IBM wants this suite of products to compete head-to-head with money-raising machine and media darling Palantir Technologies. If I’m IBM, that makes sense. Palantir has been eating Big Blue’s lunch for a few years now, particularly at the lucrative US Federal market level. Worse yet, for IBM i2, is the recent news of a new competitor with even more powerful technology.
If I’m a crime or fraud analyst, however, I have to view this as IBM moving further and further away from my reality.
The reality? Nobody has ever yelled “Help! I’ve been robbed. Call the petabytes of ‘slick’ data!” No, this tiring ‘big data’ discussion is not really part of the day to day work for the vast majority of analysts. Smart people using appropriate data with intuitive and flexible crime technology solutions… that’s the reality for most of us.
So, as IBM moves their market-leading tool higher and higher into the stratosphere, where does the industry turn for more practical desktop solutions with realistic pricing? For more and more customers around the world, the answer is a crime and fraud link analytics tool from Crime Tech Solutions.
No, it won’t ingest 20,000,000 four-drawer filing cabinets of data, and it’s more ‘efficient‘ than ‘slick‘. Still, the product has been around for decades as a strong competitor to Analysts Notebook, and is well-supported by a network of strategic partners around the world. Importantly, it is the only American made and supported alternative. Period. It’s also, seemingly, the last man standing in the market for efficient and cost-effective tools that can be used by real people doing their real jobs.
Using Link Analysis to untangle fraud webs
Posted by Douglas Wood, Editor.
NOTE: This article originally appeared HERE by Jane Antonio. I think it’s a great read…
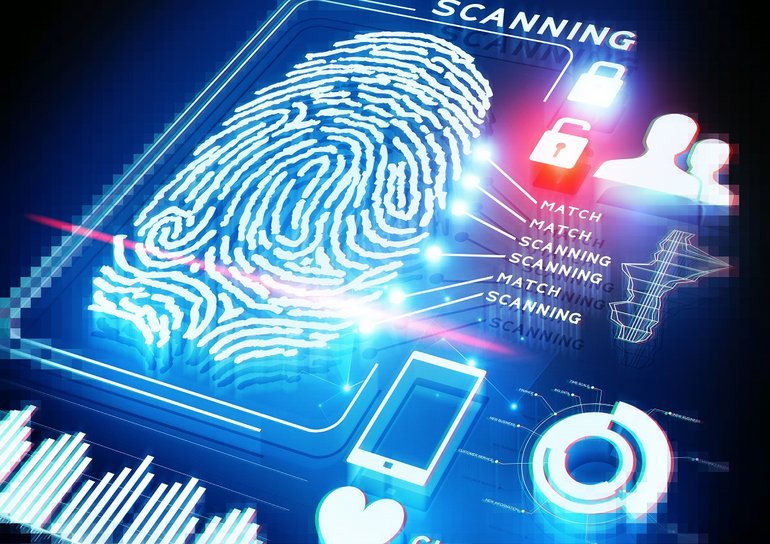
Link analysis has become an important technique for discovering hidden relationships involved in healthcare fraud. An excellent online source, FierceHealthPayer:AntiFraud, recently spoke to Vincent Boyd Bryant about the value of this tool for payer special investigations units.
A former biometric scientist for the U.S. Department of Defense, Bryant has 30 years of experience in law enforcement and intelligence analysis. He’s an internationally-experienced investigations and forensics expert who’s worked for a leading health insurer on government business fraud and abuse cases.
How does interactive link analysis help insurers prevent healthcare fraud? Can you share an example of how the tool works?
Boyd Bryant: Link analysis is most often used to piece together different kinds of data from multiple sources–to identify key players, connections between those players and patterns of behavior frequently missed. It can simplify an understanding of the level of involvement of individuals and criminal organizational hierarchies and can greatly simplify visualizing and communicating the operations of complex criminal enterprises.
One thing criminals do best is hide pots of money in different places. As a small criminal operation becomes successful, it will often expand its revenue streams through associated businesses. Link analysis is about trying to figure out where all those different baskets of revenue may be. Insurers are drowning in a sea of theft. Here’s where link analysis becomes beneficial. Once insurers discover a small basket of money lost to a criminal enterprise, then serious research needs to go into finding out who owns the company, who they’re associated with, what kinds of business they’re doing and if there are claims associated with it.
You may find a clinic, for example, connected to and working near a pharmacy, a medical equipment supplier, a home healthcare services provider and a construction company. Diving into those companies and what they do, you find that they’re serving older patients for whom multiple claims from many providers exist. The construction company may be building wheelchair ramps on homes. And you may find that the providers are claiming payment for dead people. Overall, using this tool requires significant curiosity and a willingness to look beyond the obvious.
Any investigation consists of aggregating facts, generating impressions and creating a theory about what happened. Then you work to confirm or disconfirm your theory. It’s important to have tools that let you take large masses of facts and visualize them in ways that cue you to look closer.
Let’s say you investigate a large medical practice and interview “Doctor Jones.” The day after the interview, you learn through link analysis that he transferred $11 million from his primary bank account to the Cayman Islands. And in looking at Dr. Jones’ phone records, you see he called six people, each of whom was the head of another individual practice on whose board Dr. Jones sits. Now the investigation expands, since the timing of those phone calls was contemporaneous to the money taking flight.
Why are tight clusters of similar entities possible indicators of fraud, waste or abuse?
Bryant: When you find a business engaged in dishonest practices and see its different relationships with providers working out of the same building, this gives rise to reasonable suspicion. The case merits a closer look. Examining claims and talking to members served by those companies will give you an indication of how legitimate the operation is.
What are the advantages of link analysis to payer special investigation units, and how are SIUs using its results?
Bryant: Link analysis can define relationships through data insurers haven’t always had, data that traditionally belonged to law enforcement.
Link analysis results in a visual reference that can take many forms: It can look like a family tree, an organizational chart or a time line. This reference helps investigators assess large masses of data for clustering and helps them arrive at a conclusion more rapidly.
Using link analysis, an investigator can dump in large amounts of data–such as patient lists from multiple practices–and see who’s serving the same patient. This can identify those who doctor shop for pain medication, for example. Link analysis can chart where this person was and when, showing the total amount of medication prescribed and giving you an idea of how the person is operating.
What types of data does link analysis integrate?
Bryant: Any type of data that can be sorted and tied together can be loaded into the tool. Examples include telephone records, addresses, vehicle information, corporate records that list individuals serving on boards and banking and financial information. Larger supporting documents can be loaded and linked to the charts, making cases easier to present to a jury.
Linked analysis can pull in data from state government agencies, county tax records or police records from state departments of correction and make those available in one bucket. In most cases, this is more efficient than the hours of labor needed to dig up these types of public records through site visits.
Is there anything else payers should know about link analysis that wasn’t covered in the above questions?
Bryant: The critical thing is remembering that you don’t know what you don’t know. If a provider or member is stealing from the plan in what looks like dribs and drabs, insurers may never discover the true extent of the losses. But if–as a part of any fraud allegation that arises–you look at what and who is associated with the subject of the complaint, what started as a $100,000 questionable claims allegation can expose millions of dollars in inappropriate billings spread across different entities.
Part Two: Major Investigation Analytics – Big Data and Smart Data
Posted by Douglas Wood, Editor.
As regular readers of this blog know, I spend a great deal of time writing about the use of technology in the fight against crime – financial and otherwise. In Part One of this series, I overviewed the concept of Major Investigation Analytics and Investigative Case Management.
I also overviewed the major providers of this software technology – Palantir Technologies, Case Closed Software, and Visallo. The latter two recently became strategic partners, in fact.
The major case for major case management (pun intended) was driven home at a recent crime and investigation conference in New York. Full Disclosure: I attended the conference for educational purposes as part of my role at Crime Tech Weekly. Throughout the three day conference, speaker after speaker talked about making sense of data. I think if I’d have heard the term ‘big data’ one more time I’d have gone insane. Nevertheless, that was the topic du jour as you can imagine, and the 3 V’s of big data – volume, variety, and velocity – remain a front and center topic for the vendor community serving the investigation market.
According to one report, 96% of everything we do in life – personal or at work – generates data. That statement probably best sums up how big ‘big data’ is. Unfortunately, there was very little discussion about how big data can help investigate major crimes. There was a lot of talk about analytics, for sure, but there was a noticeable lack of ‘meat on the bone’ when it came to major investigation analytics.
Nobody has ever yelled out “Help, I’ve been attacked. Someone call the big data!”. That’s because big data doesn’t, in and by itself, do anything. Once you can move ‘big data’ into ‘smart data’, however, you have an opportunity to investigate and adjudicate crime. To me, smart data (in the context of investigations) is a subset of an investigator’s ability to:
- Quickly triage a threat (or case) using only those bits of data that are most immediately relevant
- Understand the larger scope of the crime through experience and crime analytics, and
- Manage that case through intelligence-led analytics and investigative case management, data sharing, link exploration, text analytics, and so on.
Connecting the dots, as they say. From an investigation perspective, however, connecting dots can be daunting. In the children’s game, there is a defined starting point and a set of rules. We simply need to follow the instructions and the puzzle is solved. Not so in the world of the investigator. The ‘dots’ are not as easy to find. It can be like looking for a needle in a haystack, but the needle is actually broken into pieces and spread across ten haystacks.
Big data brings those haystacks together, but only smart data finds the needles… and therein lies the true value of major investigation analytics.