 Posted by Crime Tech Solutions
This article originally appeared HERE in Jamaica Observer. It’s an interesting read…
A University of the West Indies (UWI) professor is calling for the increased use of technology by developing countries, including Jamaica, to assist in the fight against crime.
Professor Evan Duggan, who is Dean of the Faculty of Social Sciences, said there have been “amazing advancements” in information and communications technologies (ICT), over the past six decades, which offer great potential for improving security strategies.
The academic, who was addressing a recent National Security Policy Seminar at UWI’s Regional Headquarters, located on the Mona campus, pointed to Kenya as a developing country that has employed the use of inexpensive technology in its crime fighting initiatives.
“Potential applications and innovations have been implemented through the use of powerful but not very expensive technologies that have allowed law enforcers to make enormous leaps in criminal intelligence, crime analysis, emergency response and policing,” he said.
He pointed to the use of a variety of mobile apps for crime prevention and reporting, web facilities, and citizen portals for the reporting of criminal activity.
Professor Duggan said that in order for Jamaica to realise the full benefit of technology in crime fighting, national security stakeholders need to engage local application developers.
“I would enjoin our stakeholders to engage the extremely creative Jamaican application developers, who now produce high quality apps for a variety of mobile and other platforms. I recommend interventions to assist in helping these groups to cohere into a unified force that is more than capable of supplying the applications we need,” he urged.
The UWI Professor pointed to the Mona Geoinformatic Institute as one entity that has been assisting in fighting crime, through analyses of crime data as well as three dimensional (3D) reconstruction of crime scenes; and mapping jurisdictional boundaries for police posts and divisions, as well as the movement of major gangs across the country.
In the meantime, Professor Duggan called for “purposeful activism” in the fight against crime and lawlessness which, he said, are “serious deterrents to economic development and national growth prospects” and could derail the national vision of developed country status by 2030.
“In the current global landscape where security challenges are proliferating across borders and have taken on multifaceted physiognomies, all hands on deck are vital,” he stressed.
“We need to …consolidate pockets of research excellence in this area …to provide the kinds of insight that will lead to more fruitful and productive collaborative engagements that are required to help us better understand the security challenges and threats from crime in order to better inform our national security architecture and direction,” he added.
What is Link / Social Network Analysis?
Posted by Crime Tech Solutions

Computer-based link analysis is a set of techniques for exploring associations among large numbers of objects of different types. These methods have proven crucial in assisting human investigators in comprehending complex webs of evidence and drawing conclusions that are not apparent from any single piece of information. These methods are equally useful for creating variables that can be combined with structured data sources to improve automated decision-making processes. Typically, linkage data is modeled as a graph, with nodes representing entities of interest and links representing relationships or transactions. Links and nodes may have attributes specific to the domain. For example, link attributes might indicate the certainty or strength of a relationship, the dollar value of a transaction, or the probability of an infection.
Some linkage data, such as telephone call detail records, may be simple but voluminous, with uniform node and link types and a great deal of regularity. Other data, such as law enforcement data, may be extremely rich and varied, though sparse, with elements possessing many attributes and confidence values that may change over time.
Various techniques are appropriate for distinct problems. For example, heuristic, localized methods might be appropriate for matching known patterns to a network of financial transactions in a criminal investigation. Efficient global search strategies, on the other hand, might be best for finding centrality or severability in a telephone network.
Link analysis can be broken down into two components—link generation, and utilization of the resulting linkage graph.
Link Generation
Link generation is the process of computing the links, link attributes and node attributes. There are several different ways to define links. The different approaches yield very different linkage graphs. A key aspect in defining a link analysis is deciding which representation to use.
Explicit Links
A link may be created between the nodes corresponding to each pair of entities in a transaction. For example, with a call detail record, a link is created between the originating telephone number and the destination telephone number. This is referred to as an explicit link.
Aggregate Links
A single link may be created from multiple transactions. For example, a single link could represent all telephone calls between two parties, and a link attribute might be the number of calls represented. Thus, several explicit links may be collapsed into a single aggregate link.
Inferred Relationships
Links may also be created between pairs of nodes based on inferred strengths of relationships between them. These are sometimes referred to as soft links, association links, or co-occurrence links. Classes of algorithms for these computations include association rules, Bayesian belief networks and context vectors. For example, a link may be created between any pair of nodes whose context vectors lie within a certain radius of one another. Typically, one attribute of such a link is the strength of the relationship it represents. Time is a key feature that offers an opportunity to uncover linkages that might be missed by more typical data analysis approaches. For example, suppose a temporal analysis of wire transfer records indicates that a transfer from account A to person X at one bank is temporally proximate to a transfer from account B to person Y at another bank. This yields an inferred link between accounts A and B. If other aspects of the accounts or transactions are also suspicious, they may be flagged for additional scrutiny for possible money laundering activity.
A specific instance of inferred relationships is identifying two nodes that may actually correspond to the same physical entity, such as a person or an account. Link analysis includes mechanisms for collapsing these to a single node. Typically, the analyst creates rules or selects parameters specifying in which instances to merge nodes in this fashion.
Utilization
Once a linkage graph, including the link and node attributes, has been defined, it can be browsed, searched or used to create variables as inputs to a decision system.
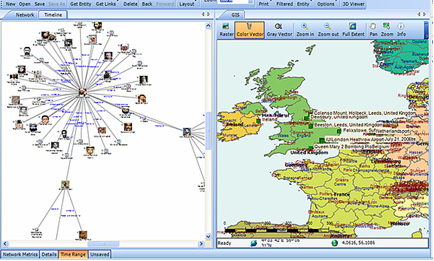
Visualization
In visualizing linking graphs, each node is represented as an icon, and each link is represented as a line or an arrow between two nodes. The node and link attributes may be displayed next to the items or accessed via mouse actions. Different icon types represent different entity types. Similarly, link attributes determine the link representation (line strength, line color, arrowhead, etc.).
Standard graphs include spoke and wheel, peacock, group, hierarchy and mesh. An analytic component of the visualization is the automatic positioning of the nodes on the screen, i.e., the projection of the graph onto a plane. Different algorithms position the nodes based on the strength of the links between nodes or to agglomerate the nodes into groups of the same kind. Once displayed, the user typically has the ability to move nodes, modify node and link attributes, zoom in, collapse, highlight, hide or delete portions of the graph.
Variable Creation
Link analysis can append new fields to existing records or create entirely new data sets for subsequent modeling stages in a decision system. For example, a new variable for a customer might be the total number of email addresses and credit card numbers linked to that customer.
Search
Link analysis query mechanisms include retrieving nodes and links matching specified criteria, such as node and link attributes, as well as search by example to find more nodes that are similar to the specified example node.
A more complex task is similarity search, also called clustering. Here, the objective is to find groups of similar nodes. These may actually be multiple instances of the same physical entity, such as a single individual using multiple accounts in a similar fashion.
Network Analysis
Network analysis is the search for parts of the linkage graph that play particular roles. It is used to build more robust communication networks and to combat organized crime. This exploration revolves around questions such as:
- Which nodes are key or central to the network?
- Which links can be severed or strengthened to most effectively impede or enhance the operation of the network?
- Can the existence of undetected links or nodes be inferred from the known data?
- Are there similarities in the structure of subparts of the network that can indicate an underlying relationship (e.g., modus operandi)?
- What are the relevant sub-networks within a much larger network?
- What data model and level of aggregation best reveal certain types of links and sub-networks?
- What types of structured groups of entities occur in the data set?
Applications
Link analysis tools such as those provided by Crime Tech Solutions are increasingly used in law enforcement investigations, detecting terrorist threats, fraud detection, detecting money laundering, telecommunications network analysis, classifying web pages, analyzing transportation routes, pharmaceuticals research, epidemiology, detecting nuclear proliferation and a host of other specialized applications. For example, in the case of money laundering, the entities might include people, bank accounts and businesses, and the transactions might include wire transfers, checks and cash deposits. Exploring relationships among these different objects helps expose networks of activity, both legal and illegal.
What is Geospatial Crime Mapping?
 Posted by Crime Tech Solutions with information gathered from Wikipedia.
Here’s a fact: Any understanding of where and why crimes occur can help prevent future crimes.
Mapping crime can help law enforcement protect citizens more effectively. Simple maps that display the locations where crimes or concentrations of crimes have occurred can be used to help direct patrols to places they are most needed. Policymakers can use more complex maps to observe trends in criminal activity; such maps can prove invaluable in solving criminal cases. For example, detectives can use maps to better understand the hunting patterns of serial criminals and to hypothesize where these offenders might live.
Products like CrimeMap Pro™ from Crime Tech Solutions are used by analysts in law enforcement agencies to map, visualize, and analyze crime incident patterns. It is a key component of crime analysis and the CompStat policing strategy. Mapping crime, using Geographic Information Systems (GIS), allows crime analysts to identify crime hot spots, along with other trends and patterns.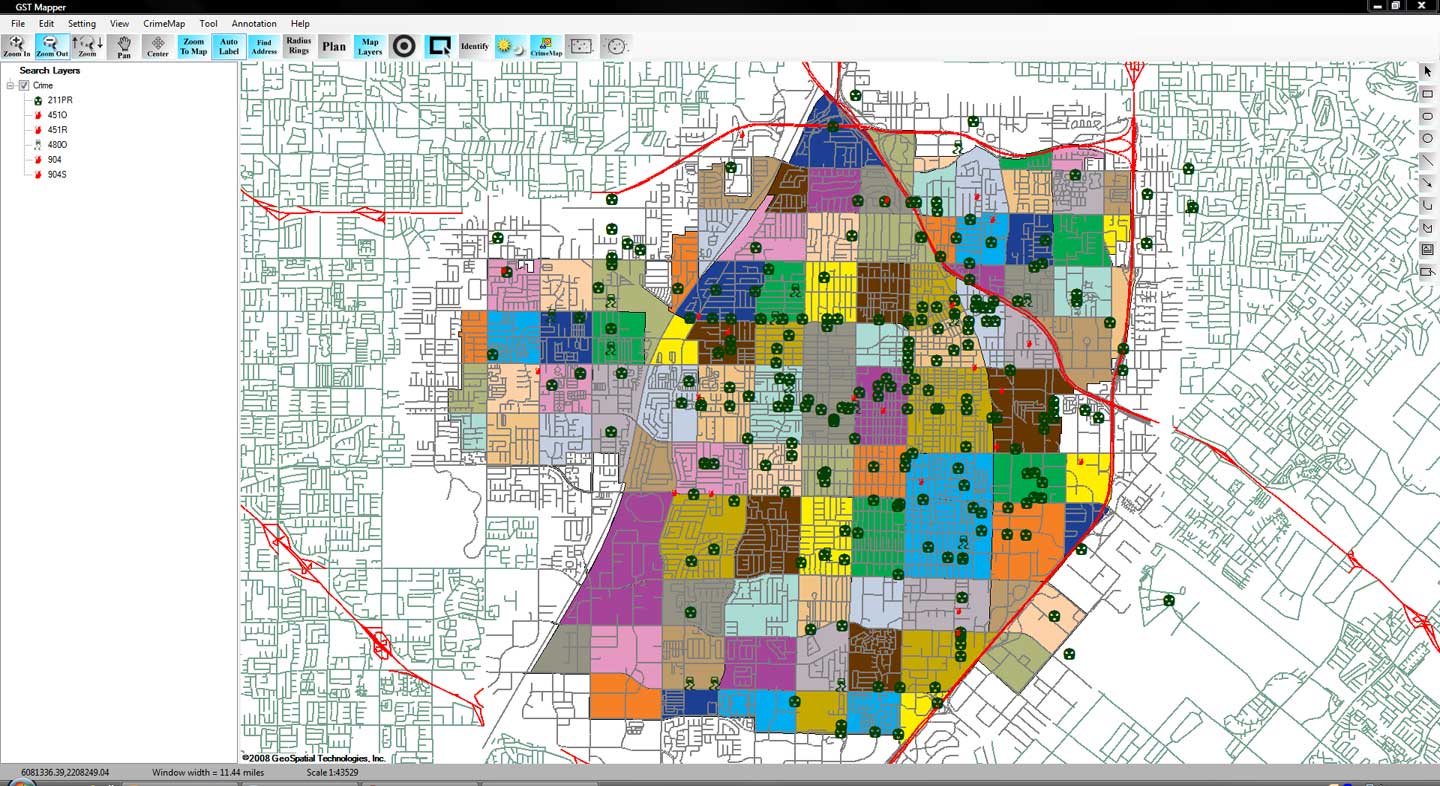
Using GIS, crime analysts can overlay other datasets such as census demographics, locations of pawn shops, schools, etc., to better understand the underlying causes of crime and help law enforcement administrators to devise strategies to deal with the problem. GIS is also useful for law enforcement operations, such as allocating police officers and dispatching to emergencies.
Crime analysts use crime mapping and analysis to help law enforcement management (e.g. the police chief) to make better decisions, target resources, and formulate strategies, as well as for tactical analysis (e.g. crime forecasting, geographic profiling). New York City does this through the CompStat approach, though that way of thinking deals more with the short term. There are other, related approaches with terms including Information-led policing, Intelligence-led policing, Problem-oriented policing, and Community policing. In some law enforcement agencies, crime analysts work in civilian positions, while in other agencies, crime analysts are sworn officers.
From a research and policy perspective, crime mapping is used to understand patterns of incarceration and recidivism, help target resources and programs, evaluate crime prevention or crime reduction programs (e.g. Project Safe Neighborhoods, Weed & Seed and as proposed in Fixing Broken Windows), and further understanding of causes of crime.
The boom of internet technologies, particularly web-based geographic information system (GIS) technologies, is opening new opportunities for use of crime mapping to support crime prevention. Research indicates that the functions provided in web-based crime mapping are less than in most traditional crime mapping software. In conclusion, existing works of web-based crime mapping focus on supporting community policing rather than analytical functions such as pattern analysis and prediction.
What the heck do Crime Analysts do?
Posted by Crime Tech Solutions – Your source for analytics in the fight against crime and fraud.
NOTE: This great article is property of International Association of Crime Analysts and is posted in it’s original format HERE…
What do Crime Analysts Do?
One: Finding Series, Patterns, Trends, and Hot Spots as They Happen
Crime analysts review all police reports every day with the goal of identifying patterns as they emerge. If a burglar starts targeting drugs stores in your jurisdiction, a crime analyst will let you know on the second incident. If domestic violence becomes a recurring problem in one family, an analyst will catch it. If your city, town, or county faces any emerging problem—youth disorder on a particular street, street robbery hot spots, new trends in fraud and forgery, a pattern of items being stolen from cars—your analyst can identify it and alert you about it as soon as possible.
Analyses of these trends, patterns, and hot spots provide you with the who, what, when, where, how, and why of emerging crime in your community. You can use this information to develop effective tactics and strategies, interceding as soon as possible, preventing victimization, and reducing crime.
Two: Researching and Analyzing Long-Term Problems
Crime analysis isn’t just about immediate patterns and series:analysts also look at the long-term problems that every police department faces. From a park that has been a drug-dealing hot spot for 20 years to a street that has a high number of car accidents to ongoing issues with crime and disorder at budget motels, a crime analyst can take it apart, explore its dimensions, and help the police department come up with long-term solutions.
Three: Providing Information on Demand
How often have you been frustrated getting the information you need from your records management or CAD system? Crime analysts know how to extract data from records systems, ask questions of it, and turn it into useful information. They know how to get data from other sources, and how to work with it. They know how to create charts, maps, graphs, tables, and other visual products.
Whether you need a list of all the incidents of youth violence over five years, or a chart showing trends in OUI arrests, or some statistics on motor vehicle citations, or a map showing an upcoming parade route, or an estimate of how many officers you’ll need in five years if current population trends continue, a trained crime analyst can put it together quickly and clearly.
Four: Developing and Linking Local Intelligence
Since September 11, 2001, we hear a lot about the need for intelligence. But what is it? And what does it have to do with local police departments?
Intelligence describes special information about criminals and criminal organizations: their goals, their activities, their chains of command, how money and goods flow through them, what they’re planning, and so on. Analyzing intelligence data on national and international problems is generally the responsibility of national and international agencies, but local police departments and local analysts play an important role.
First, as information synthesizers, crime analysts often know when local information or intelligence fits with state, national, or international intelligence. If the FBI issues a bulletin stating that terrorists are using forged passports from Belgium, your analyst will know to pay special attention when one of your reports mentions a Belgian passport. If a state agency issues a report on motorcycle gangs, your analyst can integrate that with your own police reports. In the post-September 11 world, you’re bombarded with information from multiple agencies at multiple levels; with a crime analyst, you have someone who can sift through this information and extract what’s relevant to your agency.
Second, your crime analyst can apply criminal intelligence analysis tactics to your local problems. Do you need a link chart showing the relationships between members of a local street gang? Or a carefully-crafted timeline for a court presentation? An analyst is trained in such techniques.
Five: Making Your Department Look Good
A crime analyst makes you and your agency look good to the public and to local government officials. You’re fully informed about a crime pattern before the press calls about it. The analyses, statistics, and charts on your web site and in printed publications convey that you are on top of crime and disorder. And when someone wants some information—whether a town selectman looking for statistics on juvenile liquor parties or a reporter looking for the top accident hot spots—you can provide it completely and quickly.
Crime analysts can also enhance the things you already do. Their desktop publishing skills can breathe new life into your reports, newsletters, and alerts; their graphing and charting skills can spice up your community presentations and budget requests; and their overall analysis and communications skills means that you always have someone on hand to explain crime and disorder—whether in meetings, interviews, or formal presentations—to the members of the community you serve.
How Can Crime Analysis Help Police Reduce Crime?
 Posted by Crime Tech Solutions
The following article was published just over a year ago HERE by Dr. Laura Wyckoff, a Fellow at Bureau of Justice Assistance. We think it is worth exploring:
“Focusing resources on high-crime places, high-rate offenders, and repeat victims can help police effectively reduce crime in their communities. Doing so reinforces the notion that the application of data-driven strategies, such as hotspots policing, problem-oriented policing, and intelligence-led policing, work. Police must know when, where, and how to focus limited resources, as well as how to evaluate the effectiveness of their strategies. Sound crime analysis is paramount to this success.
What is crime analysis exactly? Crime analysis is not simply crime counts or the change in crime counts—that is just information about crime and not an analysis of crime. Crime analysis is a deep examination of the relationships between the different criminogenic factors (e.g., time, place, socio-demographics) surrounding crime or disorder that helps us understand why it occurs. Sound crime analysis diagnoses problems so a response may be tailored to cure it, or reduce the frequency and severity of such problems.
Data-driven policing and associated crime analysis are still in their infancy and are not typically integrated into the organizational culture as well as traditional policing strategies. Many agencies are still not aware of the advantages of an effective crime analysis unit, and others may not have the resources or knowledge to effectively integrate one. Of those that do employ crime analysis, many may not fully understand or accept this approach, or use it to its potential.
Additionally, police command staff typically are not analysts, so they may be unaware of how to guide this work to provide “actionable” crime analysis products that can be helpful for crime reduction efforts. At the same time, analysts are usually not police officers and may not be aware of how police respond to crime problems (both tactically and strategically), or what types of products will be most useful.
To be more effective at combating crime using data-driven strategies, we need to overcome these barriers and knowledge gaps. That is why the Bureau of Justice Assistance (BJA) established the Crime Analysis on Demand initiative. This initiative has a number of training and technical assistance opportunities focused on increasing crime analysis capacity in agencies across the nation. BJA’s National Training and Technical Assistance Center (NTTAC) is providing police agencies access to crime analysis experts that provide recommendations, training, and technical assistance to help agencies improve their application of crime analysis.
Additionally, the Police Foundation’s recent Crime Mapping and Analysis News publication provides a synopsis of the different services offered through this initiative. Other resources for crime analysis can be found on the International Association of Crime Analysts and the International Association of Law Enforcement Intelligence Analysts’ web sites.”

More and more banks turning to biometrics for security
IBM Crime Analytics: Missing the mark? CTS Hits the bullseye!
 Posted by Crime Tech Solutions – Your source for analytics in the fight against crime and fraud.
September 7, 2015. IBM announced this week a major update to its IBM i2 Safer Planet intelligence portfolio that includes a major overhaul of the widely used Analyst’s Notebook product. The product, which has become increasingly abandoned by its user base over the past five years, is now being positioned as ‘slicker‘ than previous versions.
IBM suggests that the new version scales from one to 1,000 users and can ingest petabytes of information to visualize. (A single petabyte roughly translates to 20,000,000 four-drawer filing cabinets completely filled with text).
That’s a lot of data. Seems to me that analysts are already inundated with data… now they need more?
This all begs the question: “Where is IBM headed with this product?”
The evidence seems to point to the fact that IBM wants this suite of products to compete head-to-head with money-raising machine and media darling Palantir Technologies. If I’m IBM, that makes sense. Palantir has been eating Big Blue’s lunch for a few years now, particularly at the lucrative US Federal market level. Worse yet, for IBM i2, is the recent news of a new competitor with even more powerful technology.
If I’m a crime or fraud analyst, however, I have to view this as IBM moving further and further away from my reality.
The reality? Nobody has ever yelled “Help! I’ve been robbed. Call the petabytes of ‘slick’ data!” No, this tiring ‘big data’ discussion is not really part of the day to day work for the vast majority of analysts. Smart people using appropriate data with intuitive and flexible crime technology solutions… that’s the reality for most of us.
So, as IBM moves their market-leading tool higher and higher into the stratosphere, where does the industry turn for more practical desktop solutions with realistic pricing? For more and more customers around the world, the answer is a crime and fraud link analytics tool from Crime Tech Solutions.
No, it won’t ingest 20,000,000 four-drawer filing cabinets of data, and it’s more ‘efficient‘ than ‘slick‘. Still, the product has been around for decades as a strong competitor to Analysts Notebook, and is well-supported by a network of strategic partners around the world. Importantly, it is the only American made and supported alternative. Period. It’s also, seemingly, the last man standing in the market for efficient and cost-effective tools that can be used by real people doing their real jobs.
Is "Minority Report" pure fiction?
 Posted by Douglas Wood.
Journalist Raj Shekhar had an interesting article in the Times of India this week.
It’s like PreCrime, only four decades early. The “predictive policing” system seen in the Tom Cruise blockbuster Minority Report is now taking shape in Delhi. But instead of the three slime-immersed psychic “Precogs” that system relied on, Delhi Police’s crime prediction will be based on cold, hard data.
Once Enterprise Information Integration Solution or ‘EI2S’—a system that puts petabytes of information from more than a dozen crime databases at police staff’s fingertips—is ready, Delhi Police will be able to implement its ‘Crime Forecast’ plan to predict when and where criminals will strike.
The technology is not as fanciful as it seems at first and is already being tried out in many important cities, including New York, Los Angeles, London and Berlin. Officers associated with the plan say the software will analyze police data for patterns, compare it with other data from jails, courts and other crime-fighting agencies, and alert police to the likely threats. Data will be available not only on the suspects but also their likely victims.
A global tender has been floated for the project and Delhi Police is in talks with various firms for the technology.
According to the article, the system can help pre-empt many situations. For example, a violent clash between two gangs. It can identify individuals who are likely to join gangs or take to crime in an area based on the analyses of their behaviour and network. It can also curb domestic violence by identifying a pattern and predicting the next attack, the article said.
It all boils down to spotting patterns in mountains of data using tremendous computing power. A police document about the plan states that investigators should be able to perform crime series identification, crime trend identification, hot spot analysis and general analysis of criminal profiles. Link analysis will help spot common indicators of a crime by establishing associations and non obvious relationships between entities.
Using neighbourhood analysis, police will be able to understand crime events and the circumstances behind them in a small area as all the crime activity in a neighbourhood will be available for analysis. Criminal cases will be classified into multiple categories to understand what types of crime an area is prone to and the measures needed to curb them. Classification will be done through profiles of victims, suspects, localities and the modus operandi.
Another technique, called proximity analysis, will provide information about criminals, victims, witnesses and other people who are or were within a certain distance of the crime scene. By analyzing demographic and social trends, investigators will be able to understand the changes that have taken place in an area and their impact on criminality.
Network analysis will also be a part of this project to identify the important characteristics and functions of individuals within and outside a network, the network’s strengths and weaknesses and its financial and communication data.
While the system could help fight crime and rid Delhi of its ‘crime capital’ tag, it is bound to raise concerns over privacy and abuse as no predictive system can be foolproof.
Biometrics and Authentication – A new world of possibilities
This article was written  by Sacha Breite, head of future payments at SIX Payment Services. It originally appeared here on July 20, 2015.
The search for a common, international standard of payment authentication is in full flow.
Governments, retailers, banks and (not least) consumers are all eager to find a means of confirming someone’s identity beyond any doubt, secure from external hacking and technologically reliable.
The situation has become more urgent with the wildfire spread of mobile technology, opening up countless opportunities for remote transactions, but placing a growing burden on payment systems to prevent fraud and theft, both of assets and identities.
So, what are the best ways forward?
Here are some of the key technologies, with an analysis of their pros and cons:
Fingerprints and vein recognition
Already in common use at border controls and in many smartphones, fingerprint identification has become widely accepted. But concerns over its reliability and security has dissuaded banks from adopting it for payment authentication.
Some consumers fear that their fingerprint hashdata could be copied and used fraudulently, so they have switched back to pin ID. Younger consumers are more relaxed with the technology and ApplePay can be activated using fingerprint ID.
As technology develops and sensors are more widespread, some are concerned that their fingerprint ID could be captured simply by touching something, without realizing. The technology is likely to remain popular, but probably in combination with other forms of ID.
Facial recognition
Another border control technology which is likely to spread into the commercial world, this once again raises reliability concerns. What happens if one’s face alters its appearance? Can someone be impersonated by showing an image of their face?
A number of extra aspects can tighten security: infrared scanners can tell the difference between a live person and an image; a 3D scan of someone’s head provides further authentication; and iris recognition is becoming more sophisticated.
The new ‘Hello’ function on Windows 10 includes a means of unlocking one’s computer simply by looking at it. So the prospect of going to an ATM, looking at it and then getting cash out, may be possible in future (though some people will object to being filmed, on privacy grounds).
Customers taking ‘selfies’ and using these as authentication, either as a still image or a video, is another emerging form of authentication. Recently MasterCard announced plans to pilot this solution and replace passwords in 3-D Secure protected payments.
Heartbeats
Like our fingerprints and irises, everyone has a unique heartbeat. Using this for identification has the advantage that is it dynamic rather than static and therefore harder to replicate and proves that you are an actual human being.
The technology is part of many current and emerging devices, particularly for sports and fitness use, providing a ready means of integration with other systems, such as transactions or establishing ID.
Wearable technology, whether for health, fashion or communication, will give this type of authentication further impetus. So we can expect to see more of it in the years to come.
Beyond the technologies employed, there are further debates over whose responsibility it should be to develop any common standard. Governments are an obvious place to start, and indeed they have collaborated successfully to introduce border controls using biometric ID.
Yet transactions involving large amounts of money, especially ones using mobile devices, require greater security than this. People are physically present at border points and have to show their passports, so the biometrics are simply an additional security layer.
Most of the initiatives rolled out by governments using biometric ID authentication for health insurance (for example) have failed to work in the commercial sphere.
Card Schemes such as Visa and MasterCard would love to introduce such a system and have it commonly adopted internationally, since it would increase brand loyalty and probably win them new customers.
But so far, the lack of clarity over what kind of technology will be most widely accepted, by governments, consumers and by the legal world, has prevented any major financial service provider taking a leap of faith. Reliability, security and privacy issues remain unresolved.
In some ways, technology is leaping ahead of the best efforts of governments and banks, through applications like Google Street View and Google Image, where individuals can be identified through pictures taken of them without necessarily having their consent. And commercial services such as Amazon, PayPal and eBay have pioneered slimmed-down ID procedures, which may become more widely adopted.
An ever increasing amount of data is being stored on all of us, which will enable identification through many differing avenues. Irrespectively of the current position of biometrics and technology, it is vital for banking and payment infrastructure providers like SIX Payment Services, to provide high levels of security and reliability. In the near future we can expect further innovations to appear in this space, however it is still unclear which will form the basis of a single global standard, until the dust has settled from the current burst of activity.
Medicaid Fraud – The NAMPI Conference Wrap
Posted by Douglas Wood, Editor.
The National Association for Medicaid Program Integrity (NAMPI) wrapped up its 31st annual conference yesterday (August 12) in New Orleans with the theme “Jazzing up Program Integrity in the Big Easy.” I’m glad that the conference itself was full of cool presentations and networking events, because the temperature outside was Hot Hot Hot! (Note to self: One ‘Hurricane’ at Pat O’Briens on Bourbon Street is enough.)
50 years after President Lyndon Johnson signed into law legislation creating two new national health insurance programs – Medicare and Medicaid – the latter is the largest source of medical and health-related services in the US, providing healthcare to over 68 million Americans with a low income. As the number of enrollees continues to grow, so then does the challenge of maintaining program integrity and fighting the inevitable fraud that hurts us all.
As someone who markets technology solutions in the fight against fraud and crime, I found much of the conference to be right up my alley. As with any conference, much of the agenda was sponsored by vendors of data solutions and technology. Kudos to LexisNexis for sponsoring keynote speaker Elizabeth Smart, former kidnapping victim and advocate for children’s safety. Her story was a powerful way to begin the conference and the packed room was riveted by her story and courage.
NAMPI president John McCormick’s Monday morning remarks were short and sweet and set the tone for what turned out to be an excellent couple of days. In particular, I thought the breakout session on program integrity by the US Government Accountability Office was excellent, as well as a session discussing the facts and myths about Return on Investment. The panel included Illinois Inspector General Brad Hart, Ohio’s Lalita Jambhale, and Oklahoma’s Cindy Roberts. A session called Advanced Analytics was also well-attended and, in my opinion, one of the better forums.
There were several excellent vendor-specific sessions as well, most notably a session entitled “The Next Generation of Medicaid Program Integrity: Where Identity Data, Linking Technology, and Clearing Houses Intersect”, and a look at Missouri’s Medicaid Audit and Compliance programs sponsored by Truven Analytics.
A walk around the Exhibitor floor showed most of the usual suspects – HMS, Truven, SAS, IBM, and others. Each vendor had some uniqueness and most had interesting fraud detection and visual analytics. Still missing from the end-to-end solution equation, however, is an investigative case management system that is purpose designed for Medicaid fraud investigations. Most vendors talked a good talk… few could walk the walk in that area. And what about a biometrics play? Identity assurance is a key element to medical care, why not in program integrity? When will someone fill those voids?
Of note, 21CT was in attendance and had, from what I could see, one of the better overall demonstrations. Their Torch offering continues to impress. Also interesting, Appriss‘ continued push into the industry with their ever-growing database of incarceration records. All vendors performed well, and a full list of those sponsors and exhibitors can be found on the NAMPI Conference website.
Congratulations to NAMPI on an excellent conference, and here’s hoping that the ideas shared continue to put a dent in the billions lost to fraud each year.