Posted by Crime Tech Solutions
From CNN…
 http://money.cnn.com/2015/11/24/technology/targeting-terror-intelligence-isis/index.html?iid=ob_lockedrail_bottomlarge&iid=obnetwork
(NOTE: Crime Tech Solutions is an Austin, TX based provider of crime and fraud analytics software for commercial and law enforcement groups. We proudly support the Association of Certified Fraud Examiners (ACFE), International Association of Chiefs of Police (IACP), Association of Law Enforcement Intelligence Units (LEIU) and International Association of Crime Analysts (IACA). Our offerings include sophisticated link analysis software, comprehensive crime mapping and predictive policing, and criminal intelligence database management systems.)
Category Archives: Crime Technology Solutions
What is Link / Social Network Analysis?
Posted by Crime Tech Solutions

Computer-based link analysis is a set of techniques for exploring associations among large numbers of objects of different types. These methods have proven crucial in assisting human investigators in comprehending complex webs of evidence and drawing conclusions that are not apparent from any single piece of information. These methods are equally useful for creating variables that can be combined with structured data sources to improve automated decision-making processes. Typically, linkage data is modeled as a graph, with nodes representing entities of interest and links representing relationships or transactions. Links and nodes may have attributes specific to the domain. For example, link attributes might indicate the certainty or strength of a relationship, the dollar value of a transaction, or the probability of an infection.
Some linkage data, such as telephone call detail records, may be simple but voluminous, with uniform node and link types and a great deal of regularity. Other data, such as law enforcement data, may be extremely rich and varied, though sparse, with elements possessing many attributes and confidence values that may change over time.
Various techniques are appropriate for distinct problems. For example, heuristic, localized methods might be appropriate for matching known patterns to a network of financial transactions in a criminal investigation. Efficient global search strategies, on the other hand, might be best for finding centrality or severability in a telephone network.
Link analysis can be broken down into two components—link generation, and utilization of the resulting linkage graph.
Link Generation
Link generation is the process of computing the links, link attributes and node attributes. There are several different ways to define links. The different approaches yield very different linkage graphs. A key aspect in defining a link analysis is deciding which representation to use.
Explicit Links
A link may be created between the nodes corresponding to each pair of entities in a transaction. For example, with a call detail record, a link is created between the originating telephone number and the destination telephone number. This is referred to as an explicit link.
Aggregate Links
A single link may be created from multiple transactions. For example, a single link could represent all telephone calls between two parties, and a link attribute might be the number of calls represented. Thus, several explicit links may be collapsed into a single aggregate link.
Inferred Relationships
Links may also be created between pairs of nodes based on inferred strengths of relationships between them. These are sometimes referred to as soft links, association links, or co-occurrence links. Classes of algorithms for these computations include association rules, Bayesian belief networks and context vectors. For example, a link may be created between any pair of nodes whose context vectors lie within a certain radius of one another. Typically, one attribute of such a link is the strength of the relationship it represents. Time is a key feature that offers an opportunity to uncover linkages that might be missed by more typical data analysis approaches. For example, suppose a temporal analysis of wire transfer records indicates that a transfer from account A to person X at one bank is temporally proximate to a transfer from account B to person Y at another bank. This yields an inferred link between accounts A and B. If other aspects of the accounts or transactions are also suspicious, they may be flagged for additional scrutiny for possible money laundering activity.
A specific instance of inferred relationships is identifying two nodes that may actually correspond to the same physical entity, such as a person or an account. Link analysis includes mechanisms for collapsing these to a single node. Typically, the analyst creates rules or selects parameters specifying in which instances to merge nodes in this fashion.
Utilization
Once a linkage graph, including the link and node attributes, has been defined, it can be browsed, searched or used to create variables as inputs to a decision system.
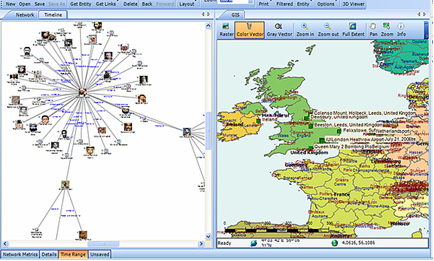
Visualization
In visualizing linking graphs, each node is represented as an icon, and each link is represented as a line or an arrow between two nodes. The node and link attributes may be displayed next to the items or accessed via mouse actions. Different icon types represent different entity types. Similarly, link attributes determine the link representation (line strength, line color, arrowhead, etc.).
Standard graphs include spoke and wheel, peacock, group, hierarchy and mesh. An analytic component of the visualization is the automatic positioning of the nodes on the screen, i.e., the projection of the graph onto a plane. Different algorithms position the nodes based on the strength of the links between nodes or to agglomerate the nodes into groups of the same kind. Once displayed, the user typically has the ability to move nodes, modify node and link attributes, zoom in, collapse, highlight, hide or delete portions of the graph.
Variable Creation
Link analysis can append new fields to existing records or create entirely new data sets for subsequent modeling stages in a decision system. For example, a new variable for a customer might be the total number of email addresses and credit card numbers linked to that customer.
Search
Link analysis query mechanisms include retrieving nodes and links matching specified criteria, such as node and link attributes, as well as search by example to find more nodes that are similar to the specified example node.
A more complex task is similarity search, also called clustering. Here, the objective is to find groups of similar nodes. These may actually be multiple instances of the same physical entity, such as a single individual using multiple accounts in a similar fashion.
Network Analysis
Network analysis is the search for parts of the linkage graph that play particular roles. It is used to build more robust communication networks and to combat organized crime. This exploration revolves around questions such as:
- Which nodes are key or central to the network?
- Which links can be severed or strengthened to most effectively impede or enhance the operation of the network?
- Can the existence of undetected links or nodes be inferred from the known data?
- Are there similarities in the structure of subparts of the network that can indicate an underlying relationship (e.g., modus operandi)?
- What are the relevant sub-networks within a much larger network?
- What data model and level of aggregation best reveal certain types of links and sub-networks?
- What types of structured groups of entities occur in the data set?
Applications
Link analysis tools such as those provided by Crime Tech Solutions are increasingly used in law enforcement investigations, detecting terrorist threats, fraud detection, detecting money laundering, telecommunications network analysis, classifying web pages, analyzing transportation routes, pharmaceuticals research, epidemiology, detecting nuclear proliferation and a host of other specialized applications. For example, in the case of money laundering, the entities might include people, bank accounts and businesses, and the transactions might include wire transfers, checks and cash deposits. Exploring relationships among these different objects helps expose networks of activity, both legal and illegal.
What is Geospatial Crime Mapping?
 Posted by Crime Tech Solutions with information gathered from Wikipedia.
Here’s a fact: Any understanding of where and why crimes occur can help prevent future crimes.
Mapping crime can help law enforcement protect citizens more effectively. Simple maps that display the locations where crimes or concentrations of crimes have occurred can be used to help direct patrols to places they are most needed. Policymakers can use more complex maps to observe trends in criminal activity; such maps can prove invaluable in solving criminal cases. For example, detectives can use maps to better understand the hunting patterns of serial criminals and to hypothesize where these offenders might live.
Products like CrimeMap Pro™ from Crime Tech Solutions are used by analysts in law enforcement agencies to map, visualize, and analyze crime incident patterns. It is a key component of crime analysis and the CompStat policing strategy. Mapping crime, using Geographic Information Systems (GIS), allows crime analysts to identify crime hot spots, along with other trends and patterns.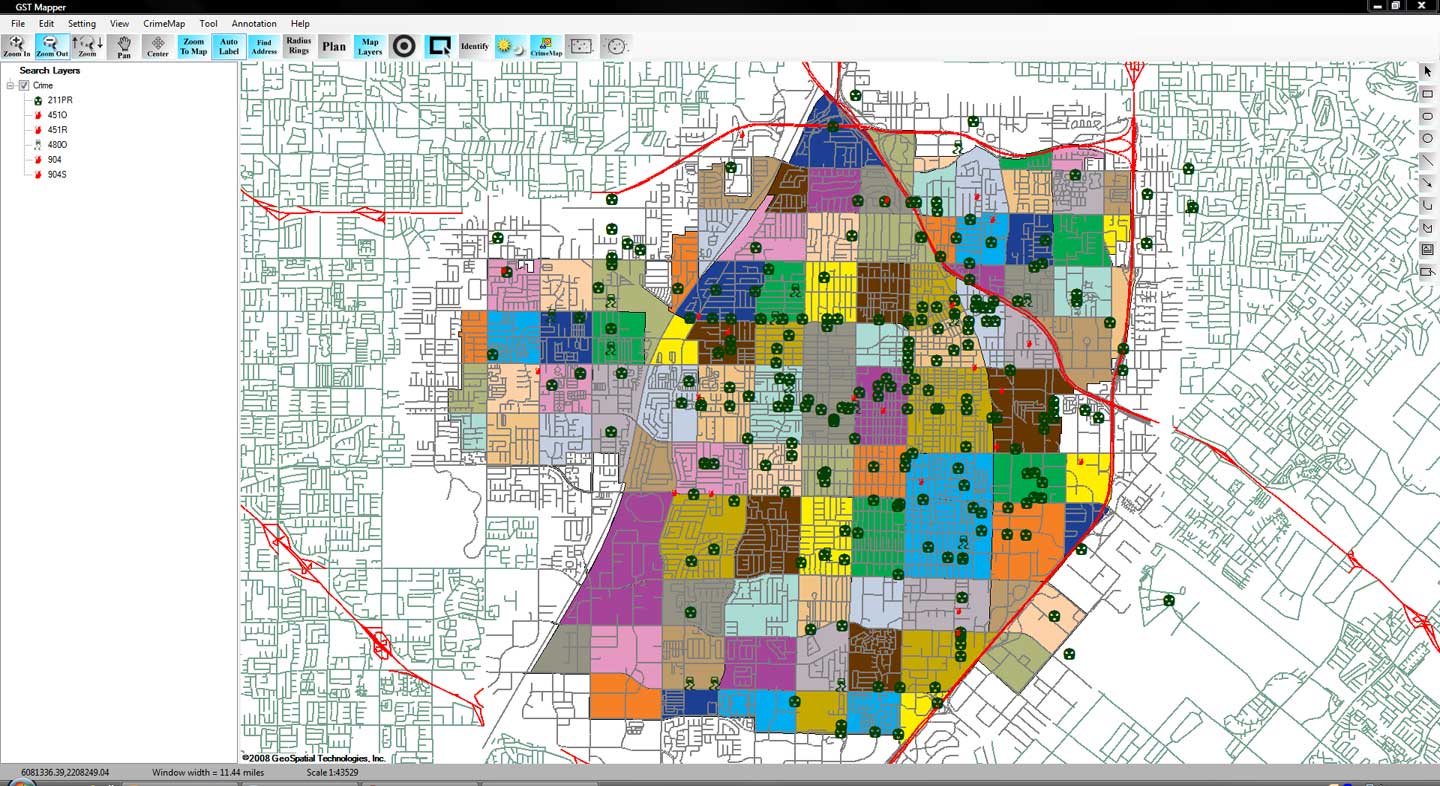
Using GIS, crime analysts can overlay other datasets such as census demographics, locations of pawn shops, schools, etc., to better understand the underlying causes of crime and help law enforcement administrators to devise strategies to deal with the problem. GIS is also useful for law enforcement operations, such as allocating police officers and dispatching to emergencies.
Crime analysts use crime mapping and analysis to help law enforcement management (e.g. the police chief) to make better decisions, target resources, and formulate strategies, as well as for tactical analysis (e.g. crime forecasting, geographic profiling). New York City does this through the CompStat approach, though that way of thinking deals more with the short term. There are other, related approaches with terms including Information-led policing, Intelligence-led policing, Problem-oriented policing, and Community policing. In some law enforcement agencies, crime analysts work in civilian positions, while in other agencies, crime analysts are sworn officers.
From a research and policy perspective, crime mapping is used to understand patterns of incarceration and recidivism, help target resources and programs, evaluate crime prevention or crime reduction programs (e.g. Project Safe Neighborhoods, Weed & Seed and as proposed in Fixing Broken Windows), and further understanding of causes of crime.
The boom of internet technologies, particularly web-based geographic information system (GIS) technologies, is opening new opportunities for use of crime mapping to support crime prevention. Research indicates that the functions provided in web-based crime mapping are less than in most traditional crime mapping software. In conclusion, existing works of web-based crime mapping focus on supporting community policing rather than analytical functions such as pattern analysis and prediction.
IBM Crime Analytics: Missing the mark? CTS Hits the bullseye!
 Posted by Crime Tech Solutions – Your source for analytics in the fight against crime and fraud.
September 7, 2015. IBM announced this week a major update to its IBM i2 Safer Planet intelligence portfolio that includes a major overhaul of the widely used Analyst’s Notebook product. The product, which has become increasingly abandoned by its user base over the past five years, is now being positioned as ‘slicker‘ than previous versions.
IBM suggests that the new version scales from one to 1,000 users and can ingest petabytes of information to visualize. (A single petabyte roughly translates to 20,000,000 four-drawer filing cabinets completely filled with text).
That’s a lot of data. Seems to me that analysts are already inundated with data… now they need more?
This all begs the question: “Where is IBM headed with this product?”
The evidence seems to point to the fact that IBM wants this suite of products to compete head-to-head with money-raising machine and media darling Palantir Technologies. If I’m IBM, that makes sense. Palantir has been eating Big Blue’s lunch for a few years now, particularly at the lucrative US Federal market level. Worse yet, for IBM i2, is the recent news of a new competitor with even more powerful technology.
If I’m a crime or fraud analyst, however, I have to view this as IBM moving further and further away from my reality.
The reality? Nobody has ever yelled “Help! I’ve been robbed. Call the petabytes of ‘slick’ data!” No, this tiring ‘big data’ discussion is not really part of the day to day work for the vast majority of analysts. Smart people using appropriate data with intuitive and flexible crime technology solutions… that’s the reality for most of us.
So, as IBM moves their market-leading tool higher and higher into the stratosphere, where does the industry turn for more practical desktop solutions with realistic pricing? For more and more customers around the world, the answer is a crime and fraud link analytics tool from Crime Tech Solutions.
No, it won’t ingest 20,000,000 four-drawer filing cabinets of data, and it’s more ‘efficient‘ than ‘slick‘. Still, the product has been around for decades as a strong competitor to Analysts Notebook, and is well-supported by a network of strategic partners around the world. Importantly, it is the only American made and supported alternative. Period. It’s also, seemingly, the last man standing in the market for efficient and cost-effective tools that can be used by real people doing their real jobs.