Tag Archives: data visualization

Visallo and Crime Tech Solutions: Partners in Crime-Fighting Software

Sterling, VA (August 24, 2017)Visallo, the Sterling, VA based provider of investigation analytics software, and only true competitor to Silicon Valley giant Palantir, today announced a strategic partnership with Crime Tech Solutions out of Leander, TX.

Visallo_CTSAccording to Jeff Kunkle, President of Visallo, the partnership enhances his company’s suite of easy-to-use, web-based data visualization tools for investigative link analysis, data discovery, crime analytics and geospatial analysis with Crime Tech Solutions’ powerful and flexible Case Closed investigation case management software.

“Visallo is designed for intelligence analysts, law enforcement investigators, and fraud analysts who need easy to use tools to help them discover and visualize complex relationships within vast amounts of data without resorting to time-consuming, ad-hoc, and error-prone manual processes,” said Mr. Kunkle. “These are analysts that want to make sure they don’t miss important non-obvious insights during their investigations, want to produce more accurate, thorough, and defensible conclusions, and ultimately seek to be more accomplished investigators able to tackle the toughest cases.”

Tyler Wood, VP of Operations at Crime Tech Solutions added, “Where Visallo does much of the big data analytics, the Case Closed software is specifically designed for investigative process and major case management. The software manages the entire investigation workflow from start to finish and includes functionality such as task management, alerting, communications, evidence management, and a great deal more.”

Until now, investigative agencies had to turn to multi-million dollar solutions from behemoth multinational companies for this combined functionality. The partnership is designed to give customers more investigation functionality at a price point that can scale down to smaller groups. “For years, only the largest law enforcement and federal agencies could afford to purchase these types of advanced tools,” added Mr. Kunkle. “The partnership between Visallo and Crime Tech Solutions changes that reality.”

The companies have indicated that integration efforts are already underway to ensure a seamless and user-friendly experience.

About Visallo
Visallo helps investigators of all types produce more accurate, thorough, and timely analysis with a software platform to help them discover, visualize, and understand complex relationships hidden in massive amounts of data. Visallo’s all-in-one suite of easy-to-use, web-based, visualization tools and machine learning data analysis algorithms augment the investigator’s hard-earned experience and intuition with data-driven insights that would be difficult, if not impossible, to discover otherwise.

About Crime Tech Solutions
Crime Tech Solutions develops and markets a robust suite of powerful software solutions designed for intelligence and investigation teams. Their flagship products include the popular Case Closed™ investigation platform and IntelNexus™, an advanced criminal intelligence management software.

SoCal City Selects Crime Tech Solutions for Link Analysis.

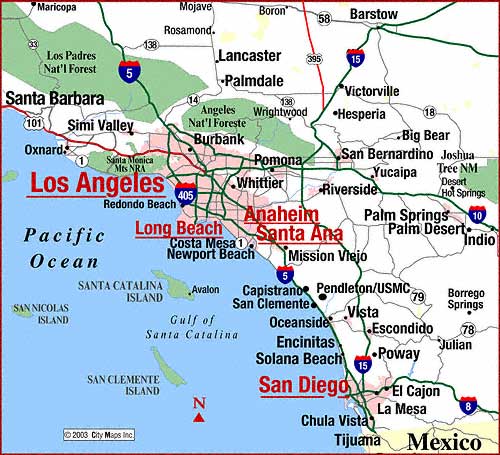
SoCalCrime Tech Solutions, LLC – a fast growing, vibrant software company based in Leander, TX today announced that a large, coastal city in California has selected them to provide sophisticated link and social network analysis software.
Crime Tech Solutions was awarded the contract based upon its price/performance leadership in the world of big data analytics for law enforcement and other investigative agencies.
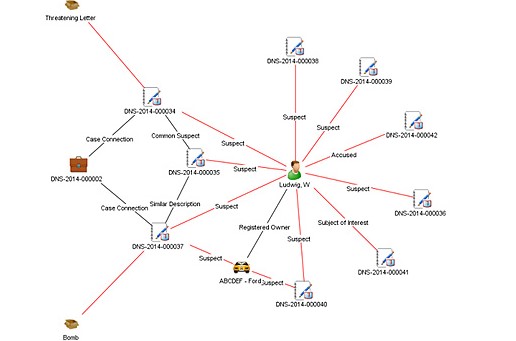
Link analysis software is used by investigators to visualize hidden connections between people, places, and things within large and disparate data sets.
20150817-daryn-visual-analysis-1
“Our link analysis software gives investigators an edge in the way they analyze data”, said Crime Tech Solutions’ CEO, Doug Wood. “By finding and displaying those hard to find connections and anomalies that reside in different data stores, our software helps investigative agencies more clearly see how networks of entities exist.”
Crime Tech Solutions said that the software implementation is already underway, and that the software will make life a little more miserable for criminals in the Southern California city.
The company also develops investigative case management and criminal intelligence software for law enforcement agencies of all sizes.
 

What is Crime Analysis?

Posted by Tyler Wood Crime Tech Solutions, your source for investigation software.
The information provided on this page comes primarily from Boba, R. (2008: Pages 3 through 6) Crime Analysis with Crime Mapping. For a full discussion of the crime analysis discipline, refer to the book which can be obtained through www.sagepub.com.
Over the past 20 years, many scholars have developed definitions of crime analysis. Although definitions of crime analysis differ in specifics, they share several common components: all agree that crime analysis supports the mission of the police agency, utilizes systematic methods and information, and provides information to a range of audiences. Thus, the following definition of crime analysis is used as the foundation of this initiative:
Crime analysis is the systematic study of crime and disorder problems as well as other police–related issues—including sociodemographic, spatial, and temporal factors—to assist the police in criminal apprehension, crime and disorder reduction, crime prevention, and evaluation.
Clarification of each aspect of this definition helps to demonstrate the various elements of crime analysis. Generally, to study means to inquire into, investigate, examine closely, and/or scrutinize information. Crime analysis, then, is the focused and systematic examination of crime and disorder problems as well as other police-related issues. Crime analysis is not haphazard or anecdotal; rather, it involves the application of social science data collection procedures, analytical methods, and statistical techniques.
More specifically, crime analysis employs both qualitative and quantitative data and methods. Crime analysts use qualitative data and methods when they examine non-numerical data for the purpose of discovering underlying meanings and patterns of relationships. The qualitative methods specific to crime analysis include field research (such as observing characteristics of locations) and content analysis (such as examining police report narratives). Crime analysts use quantitative data and methods when they conduct statistical analysis of numerical or categorical data. Although much of the work in crime analysis is quantitative, crime analysts use simple statistical methods, such as frequencies, percentages, means, and rates. Typical crime analysis tools include link analysis and crime mapping software.
The central focus of crime analysis is the study of crime (e.g., rape, robbery, and burglary); disorder problems (e.g., noise complaints, burglar alarms, and suspicious activity); and information related to the nature of incidents, offenders, and victims or targets of crime (targets refer to inanimate objects, such as buildings or property). Crime analysts also study other police-related operational issues, such as staffing needs and areas of police service. Even though this discipline is called crime analysis, it actually includes much more than just the examination of crime incidents.
Although many different characteristics of crime and disorder are relevant in crime analysis, the three most important kinds of information that crime analysts use are sociodemographic, spatial, and temporal. Sociodemographic information consists of the personal characteristics of individuals and groups, such as sex, race, income, age, and education. On an individual level, crime analysts use sociodemographic information to search for and identify crime suspects. On a broader level, they use such information to determine the characteristics of groups and how they relate to crime. For example, analysts may use sociodemographic information to answer the question, “Is there a white, male suspect, 30 to 35 years of age, with brown hair and brown eyes, to link to a particular robbery?” or “Can demographic characteristics explain why the people in one group are victimized more often than people in another group in a particular area?”
The spatial nature of crime and other police-related issues is central to understanding the nature of a problem. In recent years, improvements in computer technology and the availability of electronic data have facilitated a larger role for spatial analysis in crime analysis. Visual displays of crime locations (maps) and their relationship to other events and geographic features are essential to understanding the nature of crime and disorder. Recent developments in criminological theory have encouraged crime analysts to focus on geographic patterns of crime, by examining situations in which victims and offenders come together in time and space.
Finally, the temporal nature of crime, disorder, and other police-related issues is a major component of crime analysis. Crime analysts conduct several levels of temporal analysis, including (a) examination of long-term patterns in crime trends over several years, the seasonal nature of crime, and patterns by month; (b) examination of mid-length patterns, such as patterns by day of week and time of day; and (c) examination of short-term patterns, such as patterns by day of the week, time of day, or time between incidents within a particular crime series.
The final part of the crime analysis definition—”to assist the police in criminal apprehension, crime and disorder reduction, crime prevention, and evaluation” generally summarizes the purpose and goals of crime analysis. The primary purpose of crime analysis is to support (i.e., “assist”) the operations of a police department. Without police, crime analysis would not exist as it is defined here.
The first goal of crime analysis is to assist in criminal apprehension, given that this is a fundamental goal of the police. For instance, a detective may be investigating a robbery incident in which the perpetrator used a particular modus operandi (i.e., method of the crime). A crime analyst might assist the detective by searching a database of previous robberies for similar cases.
Another fundamental police goal is to prevent crime through methods other than apprehension. Thus, the second goal of crime analysis is to help identify and analyze crime and disorder problems as well as to develop crime prevention responses for those problems. For example, members of a police department may wish to conduct a residential burglary prevention campaign and would like to target their resources in areas with the largest residential burglary problem. A crime analyst can assist by conducting an analysis of residential burglary to examine how, when, and where the burglaries occurred along with which items were stolen. The analyst can then use this information to develop crime prevention suggestions, (such as closing and locking garage doors) for specific areas.
Many of the problems that police deal with or are asked to solve are not criminal in nature; rather, they are related to quality of life and disorder. Some examples include false burglar alarms, loud noise complaints, traffic control, and neighbor disputes. The third goal of crime analysis stems from the police objective to reduce crime and disorder. Crime analysts can assist police with these efforts by researching and analyzing problems such as suspicious activity, noise complaints, code violations, and trespass warnings. This research can provide officers with information they can use to address these issues before they become more serious criminal problems.
The final goal of crime analysis is to help with the evaluation of police efforts by determining the level of success of programs and initiatives implemented to control and prevent crime and disorder and measuring how effectively police organizations are run. In recent years, local police agencies have become increasingly interested in determining the effectiveness of their crime control and prevention programs and initiatives. For example, an evaluation might be conducted to determine the effectiveness of a two-month burglary surveillance or of a crime prevention program that has sought to implement crime prevention through environmental design (CPTED) principles within several apartment communities. Crime analysts also assist police departments in evaluating internal organizational procedures, such as resource allocation (i.e., how officers are assigned to patrol areas), realignment of geographic boundaries, the forecasting of staffing needs, and the development of performance measures. Police agencies keep such procedures under constant scrutiny in order to ensure that the agencies are running effectively.
In summary, the primary objective of crime analysis is to assist the police in reducing and preventing crime and disorder. Present cutting edge policing strategies, such as hotspots policing, problem-oriented policing, disorder policing, intelligence-led policing, and CompStat management strategies, are centered on directing crime prevention and crime reduction responses based on crime analysis results. Although crime analysis is recognized today as important by both the policing and the academic communities, it is a young discipline and is still being developed. Consequently, it is necessary to provide new and experienced crime analysts with training and assistance that improves their skills and provides them examples of best practices from around the country and the world. http://crimetechsolutions.com

 

What is Link / Social Network Analysis?

Posted by Crime Tech SolutionsPic003

Computer-based link analysis is a set of techniques for exploring associations among large numbers of objects of different types. These methods have proven crucial in assisting human investigators in comprehending complex webs of evidence and drawing conclusions that are not apparent from any single piece of information. These methods are equally useful for creating variables that can be combined with structured data sources to improve automated decision-making processes. Typically, linkage data is modeled as a graph, with nodes representing entities of interest and links representing relationships or transactions. Links and nodes may have attributes specific to the domain. For example, link attributes might indicate the certainty or strength of a relationship, the dollar value of a transaction, or the probability of an infection.

Some linkage data, such as telephone call detail records, may be simple but voluminous, with uniform node and link types and a great deal of regularity. Other data, such as law enforcement data, may be extremely rich and varied, though sparse, with elements possessing many attributes and confidence values that may change over time.
Various techniques are appropriate for distinct problems. For example, heuristic, localized methods might be appropriate for matching known patterns to a network of financial transactions in a criminal investigation. Efficient global search strategies, on the other hand, might be best for finding centrality or severability in a telephone network.
Link analysis can be broken down into two components—link generation, and utilization of the resulting linkage graph.
Link Generation
Link generation is the process of computing the links, link attributes and node attributes. There are several different ways to define links. The different approaches yield very different linkage graphs. A key aspect in defining a link analysis is deciding which representation to use.
Explicit Links
A link may be created between the nodes corresponding to each pair of entities in a transaction. For example, with a call detail record, a link is created between the originating telephone number and the destination telephone number. This is referred to as an explicit link.
Aggregate Links
A single link may be created from multiple transactions. For example, a single link could represent all telephone calls between two parties, and a link attribute might be the number of calls represented. Thus, several explicit links may be collapsed into a single aggregate link.
Inferred Relationships
Links may also be created between pairs of nodes based on inferred strengths of relationships between them. These are sometimes referred to as soft links, association links, or co-occurrence links. Classes of algorithms for these computations include association rules, Bayesian belief networks and context vectors. For example, a link may be created between any pair of nodes whose context vectors lie within a certain radius of one another. Typically, one attribute of such a link is the strength of the relationship it represents. Time is a key feature that offers an opportunity to uncover linkages that might be missed by more typical data analysis approaches. For example, suppose a temporal analysis of wire transfer records indicates that a transfer from account A to person X at one bank is temporally proximate to a transfer from account B to person Y at another bank. This yields an inferred link between accounts A and B. If other aspects of the accounts or transactions are also suspicious, they may be flagged for additional scrutiny for possible money laundering activity.
A specific instance of inferred relationships is identifying two nodes that may actually correspond to the same physical entity, such as a person or an account. Link analysis includes mechanisms for collapsing these to a single node. Typically, the analyst creates rules or selects parameters specifying in which instances to merge nodes in this fashion.
Utilization
Once a linkage graph, including the link and node attributes, has been defined, it can be browsed, searched or used to create variables as inputs to a decision system.
Visualization
In visualizing linking graphs, each node is represented as an icon, and each link is represented as a line or an arrow between two nodes. The node and link attributes may be displayed next to the items or accessed via mouse actions. Different icon types represent different entity types. Similarly, link attributes determine the link representation (line strength, line color, arrowhead, etc.).
Standard graphs include spoke and wheel, peacock, group, hierarchy and mesh. An analytic component of the visualization is the automatic positioning of the nodes on the screen, i.e., the projection of the graph onto a plane. Different algorithms position the nodes based on the strength of the links between nodes or to agglomerate the nodes into groups of the same kind. Once displayed, the user typically has the ability to move nodes, modify node and link attributes, zoom in, collapse, highlight, hide or delete portions of the graph.
Variable Creation
Link analysis can append new fields to existing records or create entirely new data sets for subsequent modeling stages in a decision system. For example, a new variable for a customer might be the total number of email addresses and credit card numbers linked to that customer.
Search
Link analysis query mechanisms include retrieving nodes and links matching specified criteria, such as node and link attributes, as well as search by example to find more nodes that are similar to the specified example node.
A more complex task is similarity search, also called clustering. Here, the objective is to find groups of similar nodes. These may actually be multiple instances of the same physical entity, such as a single individual using multiple accounts in a similar fashion.
Network Analysis
Network analysis is the search for parts of the linkage graph that play particular roles. It is used to build more robust communication networks and to combat organized crime. This exploration revolves around questions such as:

  • Which nodes are key or central to the network?
  • Which links can be severed or strengthened to most effectively impede or enhance the operation of the network?
  • Can the existence of undetected links or nodes be inferred from the known data?
  • Are there similarities in the structure of subparts of the network that can indicate an underlying relationship (e.g., modus operandi)?
  • What are the relevant sub-networks within a much larger network?
  • What data model and level of aggregation best reveal certain types of links and sub-networks?
  • What types of structured groups of entities occur in the data set?

Applications
Link analysis tools such as those provided by Crime Tech Solutions are increasingly used in law enforcement investigations, detecting terrorist threats, fraud detection, detecting money laundering, telecommunications network analysis, classifying web pages, analyzing transportation routes, pharmaceuticals research, epidemiology, detecting nuclear proliferation and a host of other specialized applications. For example, in the case of money laundering, the entities might include people, bank accounts and businesses, and the transactions might include wire transfers, checks and cash deposits. Exploring relationships among these different objects helps expose networks of activity, both legal and illegal.